504 with no high CPU, no queue, no RDS: when the infrastructure is green but the payment gateway stopped responding
Published on April 25, 2026
The incident the dashboards didn't show
A fintech client reported a Gateway Time-out (504 error) on the sales page. The timestamp on the Cloudflare screenshot: 8:25 PM local time. I went to check what had happened.
I opened the dashboards. ASG CPU: 4.1-4.4%. ListenQueue across all three PHP-FPM pools (pool0, pool1, pool2): 0 throughout the entire window. RDS CPU: 1-11% average, peaking at 11.5%. Zero signs of overload at any infrastructure layer.
This is the classic infrastructure monitoring trap: it measures what the server is doing, not what the server is waiting for. Blocking I/O — a PHP thread stuck waiting for a response from an external API — consumes zero CPU and zero queue capacity.
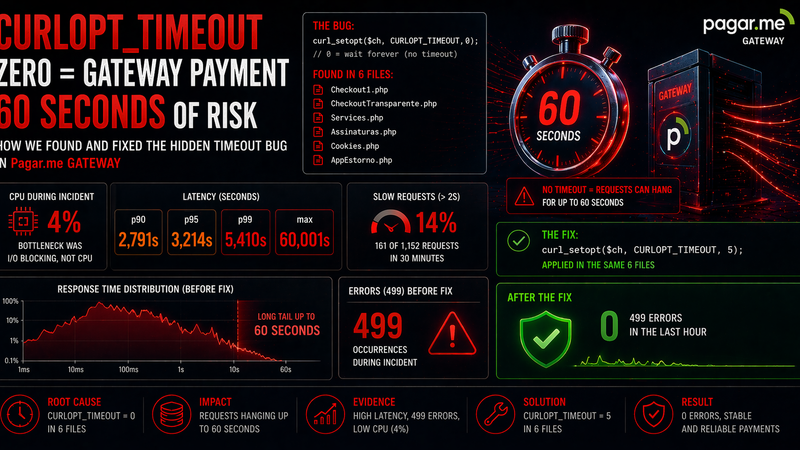
This post is the companion to our deep-dive on CURLOPT_TIMEOUT=0 in the payment gateway. That post focused on the root cause in the code. This one focuses on the monitoring angle: why the incident was invisible to standard alerts, what the logs were actually showing, and how to detect this pattern before the user reports it.
What the logs were showing
Nginx had three relevant entries in the 8:23-8:27 PM window:
# nginx access log — /sales page, incident window
8:23:09 PM  GET /sales  499  59.997s
8:25:19 PM  GET /sales  499  60.001s   ← client's screenshot
8:26:28 PM  GET /sales  499  59.998s
Status 499 means the client closed the connection before receiving a response. Cloudflare has a 60-second timeout — when the origin doesn't respond in 60s, Cloudflare closes the connection (generating the 504 in the browser) and nginx logs 499 because the client (Cloudflare) disconnected. PHP kept running after the 499.
Three requests, each blocked for exactly 60 seconds. A 4-minute window. After that, the endpoint returned to normal response times of 0.2-3.6s.
In the PHP-FPM debug logs there was an important clue: calls to the payment gateway with fields like `available_amount`, `waiting_funds_amount`, and `transferred_amount` — exactly the recipient balance query endpoint. At 8:26:53 PM, the gateway's response appeared: HTTP 404 with the message 'Recipient not found'. The gateway was having problems.
Why the monitors saw nothing
The absence of signal on the dashboards wasn't a failure of the monitors — it was a characteristic of the type of failure. Monitoring CPU, memory, ListenQueue, and RDS are the right metrics for detecting infrastructure overload. But this incident wasn't overload: it was blocking.
ListenQueue = 0 doesn't mean workers are free
ListenQueue measures how many requests are waiting for a PHP-FPM worker to become available. With three requests taking 60 seconds each, the queue stayed nearly empty — there were workers available to accept new connections. The problem was that the accepted workers got stuck waiting for the gateway to respond, without appearing in the queue.
Low CPU is evidence of blocking I/O, not of health
A PHP worker stuck in curl_exec() waiting for a TCP response from the gateway consumes no CPU. The process stays in I/O wait state — visible via ps aux as state 'S' (sleeping/interruptible). From CloudWatch's perspective, the server is idle.
Healthy RDS confirms the problem wasn't the database
RDS CPU at 1-11% with no connection spikes ruled out any hypothesis of slow query or database lock. The blocking was happening before any database query was made — the controller was rendering account balance (via the gateway call) before any query ran.
# Status distribution in nginx during the incident window
# Using spaces around 499 to avoid false positives (e.g. "4990")
grep ' 499 ' /var/log/nginx/access.log |   awk '{print $7, $NF"s"}' |   grep '/sales'

# Check for stuck PHP workers at the time of the incident
curl -s http://localhost/fpm-status?full |   grep -E 'state|request uri|request duration' |   paste - - -
The second command would have shown workers in 'Reading headers' state for tens of seconds — waiting for the HTTP response from the gateway. With three workers simultaneously stuck on 60-second requests, processing capacity for new requests was reduced, but without overflowing the total pool.
The complete timeline
8:22 PM — /sales responding normally (1-3s)
8:23 PM — gateway starts hanging → first request blocks for 60s
8:25 PM — second request blocks for 60s (client's screenshot)
8:26 PM — third request blocks for 60s
8:26:53  — gateway returns HTTP 404 "Recipient not found"
8:27 PM — /sales returns to normal (0.2-3.6s)
8:31 PM — /sales very fast (0.012-0.025s, cache or light data)
8:51 PM — another 60s 499 on /sales (recurring problem that day)
Total duration of the critical window: approximately 4 minutes. The incident recurred at 8:51 PM — the same pattern, confirming the payment gateway had recurring issues that day.
What standard monitoring doesn't cover
Most monitoring setups for PHP applications on AWS cover: instance CPU, memory usage, PHP-FPM ListenQueue, RDS CPU/latency, and 5xx HTTP status at the ALB/CloudFront layer. This is sufficient to detect infrastructure overload. But there's a gap:
499 errors with request_time > 10s in nginx don't appear as 5xx and don't trigger standard error alerts. Cloudflare transforms the 499 into a 504 for the end user, but the origin log records 499 — and most dashboards filter only 5xx.
The metric that detects this pattern is simple: count of 499 statuses with response time above a threshold (for example, 30s). If that count rises, there are workers stuck in blocking I/O — regardless of CPU and queue being green.
# CloudWatch Logs Insights — detect slow 499s in nginx
fields @timestamp, @message
| filter @message like ' 499 '
| parse @message '* * * * * * * *s' as host, remote, dash, user, time, method, uri, duration
| filter duration > 30
| stats count() as timeout_count by bin(5m)
| sort @timestamp desc
An alert for '3 or more 499s with request_time > 30s in 5 minutes' on the /sales endpoint would have fired at 8:23 PM — 2 minutes before the client's screenshot arrived.
The root cause and the fix
The sales controller was making a synchronous call to the payment gateway to fetch recipient balance during page render. The method used for all gateway calls had CURLOPT_TIMEOUT => 0 — which in cURL doesn't mean 'no setting', it means 'wait indefinitely'.
The fix applied was adding an explicit timeout to the central method used by all calls, covering all gateway endpoints at once:
// Before — infinite timeout on all gateway calls
CURLOPT_TIMEOUT => 0,

// After — fail fast in 8s, reconnect timeout 5s
CURLOPT_TIMEOUT => 8,
CURLOPT_CONNECTTIMEOUT => 5,
Immediate result after deploy: the 60-second 499s on /sales dropped to zero. Latency p99 returned to under 1 second. The complementary recommendation to the development team was to add a fallback in the controller: if the gateway doesn't respond in 8s, render the page with balance as '--' instead of blocking the entire request.
Operational lesson
Green infrastructure does not mean healthy application. Low CPU, empty queue, and stable database are necessary conditions for health, but not sufficient. A controller making a synchronous call to an external service with no timeout configured is an availability risk vector that no infrastructure monitor will detect — because the problem is not in the infrastructure.
The correct monitoring for this pattern operates at the application layer: count of 499s with high request_time, latency percentiles per endpoint, and timeout alerts on external API calls. Without this, the first signal of a problem arrives via a user screenshot — not via an alert.